
Reference: http://www.prism.oregonstate.edu/
Comprehensive Reference Publication: Daly, C., Halbleib, M., Smith, J.I., Gibson, W.P., Doggett, M.K.,
The PRISM Climate Mapping Program (Dr. Christopher Daly, Assistant Professor, NACSE Oregon State University; George Taylor, State Climatologist and Oregon Climate Services) is an ongoing effort to produce and disseminate the most detailed, highest-quality spatial climate datasets currently available. The digital climate maps accessible on the WestMap site are created using PRISM (Parameter-elevation Regressions on Independent Slopes Model) an analytical tool that uses point data, a digital elevation model, and other spatial data sets to generate fine scale grid-based estimates of monthly, yearly, and event-based climatic parameters, such as precipitation, temperature, and dew point. One resulting product is the series of fine-scale spatial climate maps accessible on this site. PRISM is uniquely designed and constantly updated to map climate in the most difficult situations, including high mountains, rain shadows, temperature inversions, coastal regions, and other complex climatic regimes. PRISM derived data sets are being used by research and operational stakeholders for applications of climatology, hydrology, natural resources, global climate change, land use, planning, relocation, education, and geography.
HOW does the PRISM model create climate maps?
PRISM uses point
measurements of climate data and a digital elevation model of terrain to create
estimates of monthly climate elements.
Estimates are derived for a grid, in our case a 4km grid, for ease in
mapping and GIS applications. PRISM is
an integrated set of rules, decision making, and calculations designed to
imitate the process an expert climatologist would go through when mapping
climate data.
Technical Description: The PRISM
system determines climate at grid cells by calculating linear relationships
between the climate element in question (like precipitation) and elevation. The
slope of these linear regression lines changes locally with elevation, as
dictated by the available point climate data. Each grid cell estimate is then
achieved by determining a separate regression function using data from many
nearby climate stations. Each station in the multiple regression is weighted
based on five factors: Distance, elevation, vertical layer, topographic facet,
and coastal proximity. In short, the closer a given station is to a target grid
cell in distance and elevation, and the more similar that station is in its climatology
to the cell (given by the other three factors), the higher the weight the
station will have on the final, predicted value for that cell. A technique
within PRISM determines the lowest possible prediction error
for the map as a whole (all cells). (Source: http://www.prism.oregonstate.edu/)
Special Features
(source: http://www.prism.oregonstate.edu/)
- Incorporates topographic effects on
temperature and precipitation
- Captures rain shadows in great detail
- Includes coastal and lake effects
- Accounts for the varying ability of
terrain features to enhance precipitation
- Consistent treatment and spatial quality control of station data
- Consistent coverage across all state boundaries
- "Universal" geographic
(latitude/longitude) projection allows conversion to any other coordinate
system
WHICH PRISM products are
available in this toolbox?
WestMap tools are designed to be used with PRISM monthly data, namely, monthly mean precipitation, maximum temperature, minimum temperature, and mean temperature over the available period of record, 1898-2007. Currently, our operational server allows access to PRISM maps and data for the Western United States. However, the WestMap user resources have been carefully designed to allow future expansion of offerings.
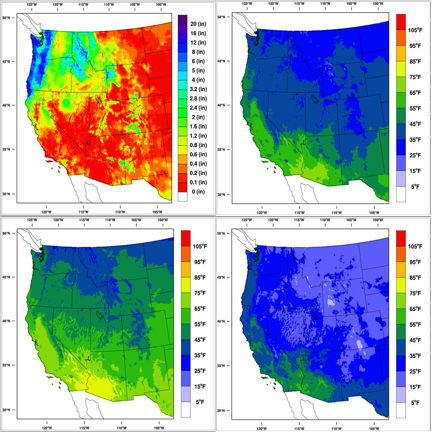
Top Left: PRISM Precipitation totals (inches) for western U.S.; November 2007; state subdivisions are shown;
PRISM Primary Metadata: Time period: 1895-present;
Time interval: monthly; Spatial format: grid;l Data format: ARC/Info ASCII
GRID; Projection: Geographic; Spatial resolution: 2.5 arc-minutes
(~4 km); Spatial Extent: Conterminous United States; Units: Millimeters
(precip) and Celsius (temperature)
·
The Prism Group: http://www.prism.oregonstate.edu/
·
Climate Mapping with Prism: PRISM Guide Book
· Metadata: Toolbox or PRISM site
·
Western Region
Climate Center: WRCC